
Caitlin Haedrich
Visualizations Made with kepler.gl
As part of Professor Laura Tateosian’s Geovisualization course, we learned how to make geovisualizations with Kepler.gl, a open-source web-based visualization application developed by the software engineers and data scientists at Uber. For lab, we made two visualizations, one of crime reports in Raleigh, NC and another using our own data.
Raleigh Crime
This is a static image of the interactive map we built in Kepler. Because of the database size, it’s too large to host on this website.
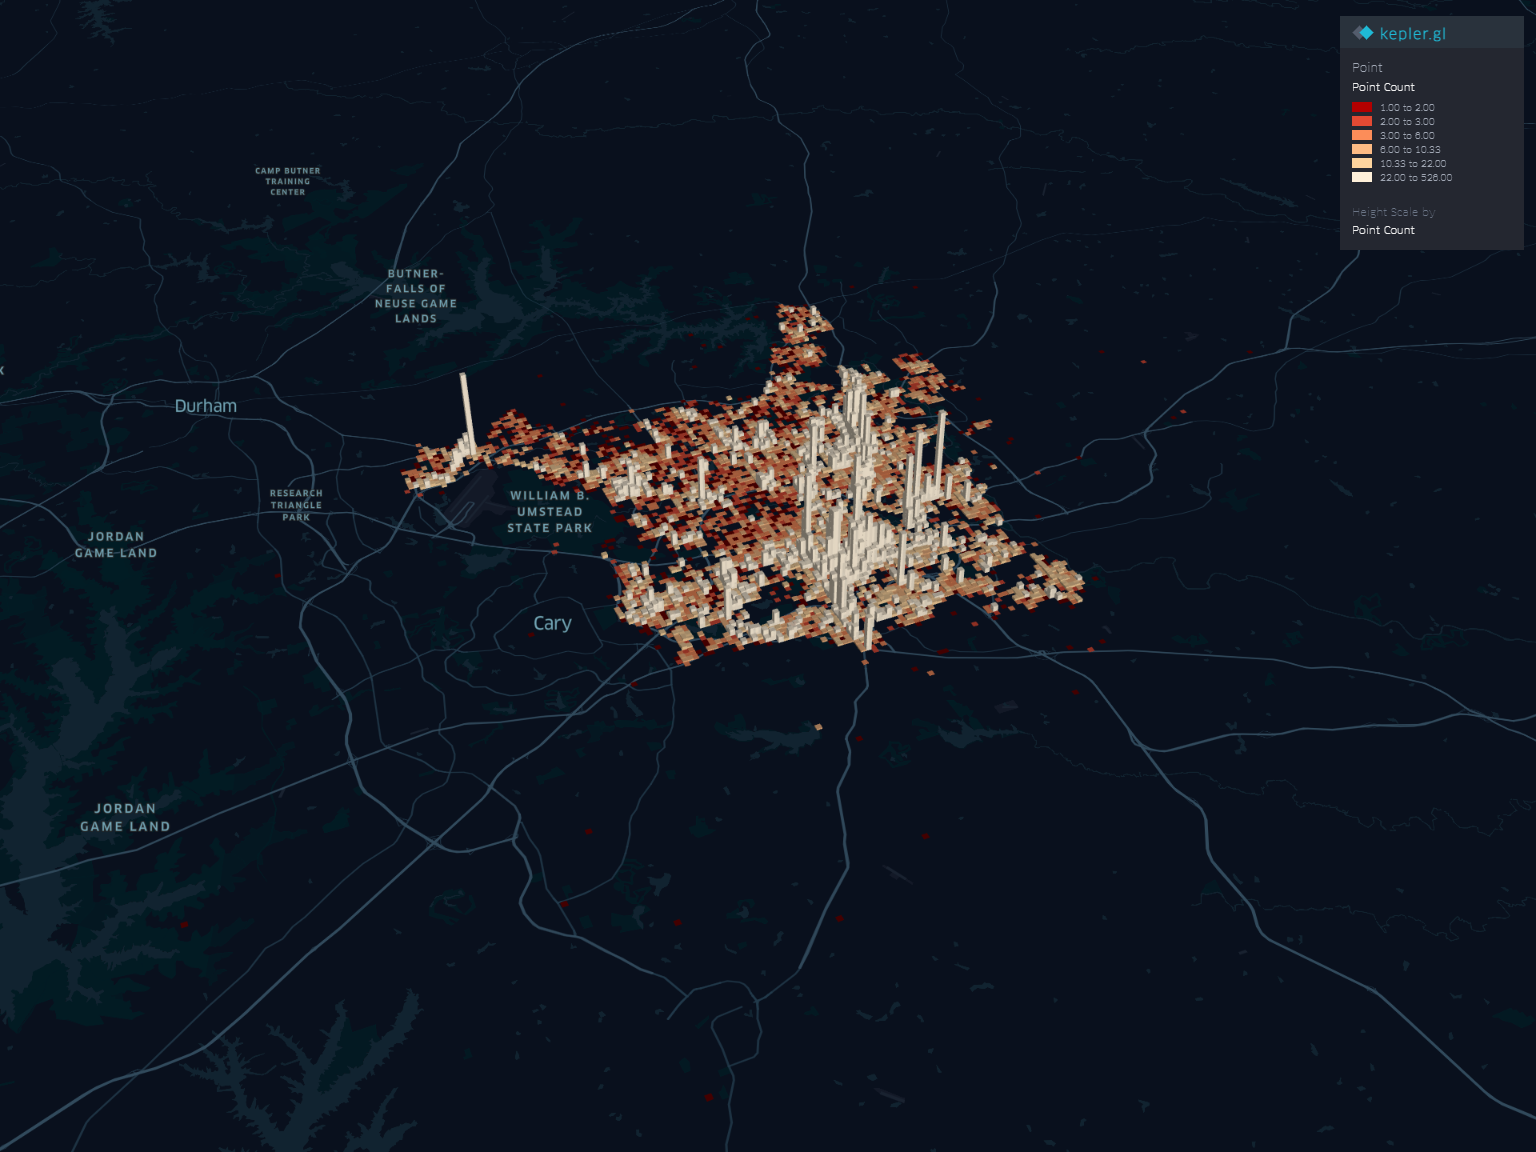 Click image to see full size.
Vermont Composting
Click link to see visualization.
I found an interesting dataset from the Vermont GIS Data Portal on Food Scrap Generators in Vermont. The dataset contains records of businesses and institutions such as restaurants, grocery stores, food manufacturers, and hospitals and an estimate of how much food waste they produce. I think this dataset was likely created because of Vermont’s recent mandatory composting law. So, if you’ve been thinking of starting a composting business and are wondering where in Vermont the demand is highest, look no further!
** A disclaimer about the data quality from VT Geodata: “This map contains inaccuracies. With over 6,000 entries and a near constant opening and closing of businesses around the state, it is challenging to keep up-to-date information. Weekly food scrap tonnages for food scrap generators are estimates only.”